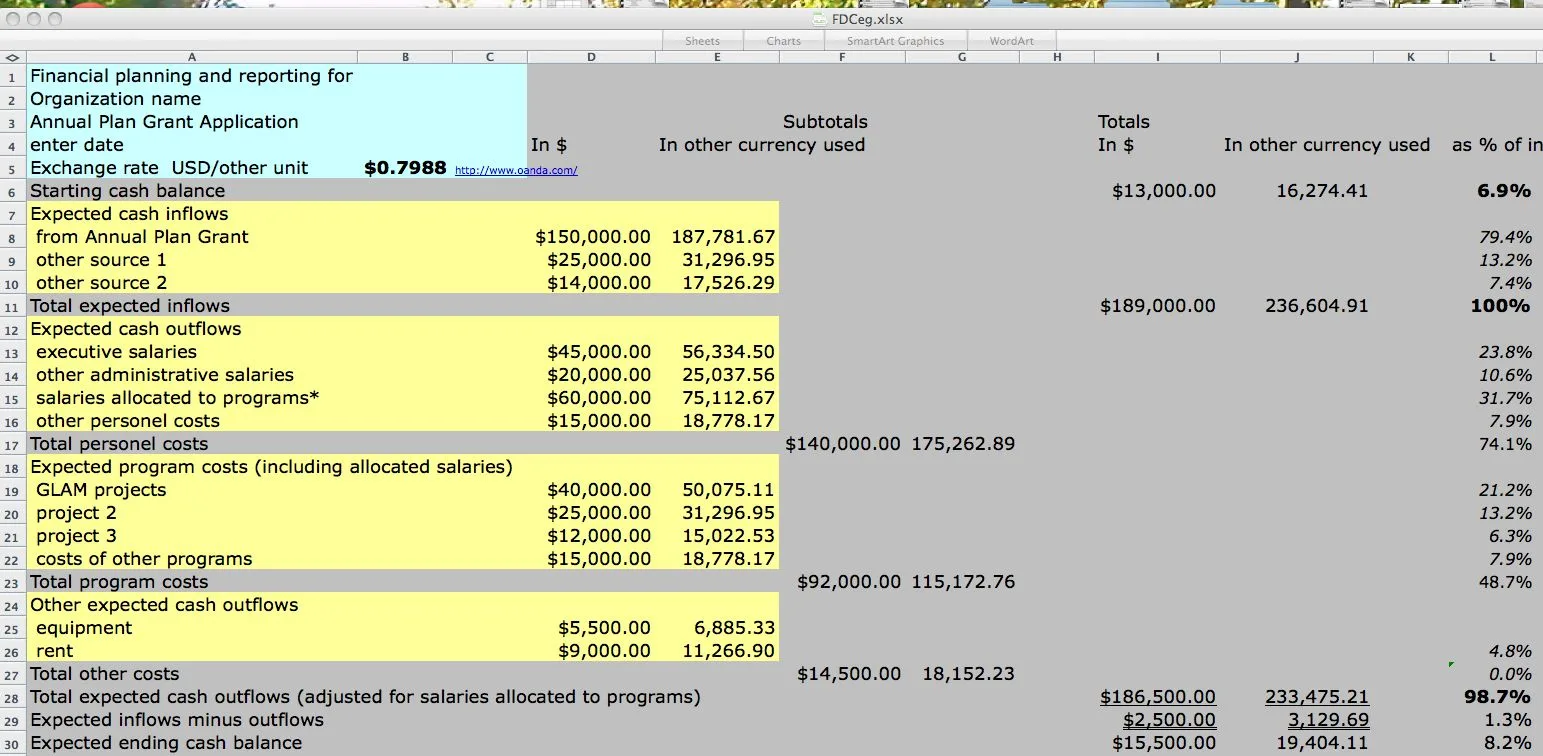
The short answer: To build a cash flow forecast, begin with reconciled bank cash, add receipts scheduled by a collection curve, and subtract each disbursement on its payment date. In the modelled quarter below, a 12-point deterioration in collections reduces December liquidity headroom from $234,200 to $25,400.
- Every period applies one identity: opening cash plus receipts minus disbursements equals closing cash, and each closing balance becomes the subsequent period’s opening balance.
- A collection curve derived from 6–12 months of paid invoices preserves the slow-paying tail that a single days-sales-outstanding average obscures.
- Federal employment tax liabilities of $100,000 or more require deposit by the next business day, which can relocate a month-end payroll deposit into the following month.
- The direct method governs liquidity decisions across 13 weeks to 6 months, while the indirect method, built from projected net income, supports planning across 12 months and beyond.
- Evaluate each period by absolute percentage error, and recalibrate the curve whenever consecutive variances fall on the same side.
Last updated September 2026.
A forecast can contain accurate totals and still fail on timing. Models assume collections a month early, position a tax deposit in the wrong column, or omit an annual renewal entirely. Disciplined construction prevents each of those errors.
The methodology below follows a modelled B2B services company generating $19.4M in annual revenue and invoicing approximately $1.6M monthly. It projects October through December 2026 on a monthly basis. Every figure is illustrative, and the arithmetic appears in full so each line remains traceable.
What is the formula for a cash flow forecast?
Closing cash equals opening cash plus cash receipts minus cash disbursements. The identity repeats for every period, and each closing balance becomes the opening balance of the following period.
The calculation remains identical in week 1 and month 12; only the inputs vary. Receipts include customer collections, loan proceeds, and tax refunds. Disbursements include net payroll, employment tax deposits, vendor payments, occupancy costs, and debt service.
Timing determines accuracy. An invoice belongs in the period its payment clears the bank, and a vendor obligation belongs in the period its payment actually leaves. The definition of a cash flow forecast explains why this cash basis diverges from GAAP profitability. The procedure below converts that principle into an operating model.
Should a forecast use the direct or the indirect method?
Use the direct method for liquidity decisions within approximately six months, and the indirect method for longer-range financial planning. The two approaches begin from different figures and answer different operational questions.
| Method | Starting point | Typical horizon | Core inputs | Principal limitation |
|---|---|---|---|---|
| Direct | Reconciled bank cash | 13 weeks to 6 months | Receivables aging, collection curve, payroll calendar, vendor terms | Labor-intensive beyond two quarters |
| Indirect | Projected net income | 12–36 months | Budgeted income statement, days sales outstanding, days payable, capital expenditures | Conceals the week payroll clears |
| Driver-based | Operating drivers | 12–18 months | Bookings, headcount, billing rates, customer retention | Requires reliable history for calibration |
The indirect method borrows its logic from GAAP financial reporting. FASB Statement 95, now codified in ASC 230, required “the reconciliation of net income to net cash flow from operating activities” under either reporting method. An indirect forecast applies that identical bridge to projected figures.
Receivables dominate that reconciliation. At $19.4M of annual revenue, each additional day of days sales outstanding represents approximately $53,151 of receivables. An increase from 52 to 58 days therefore absorbs roughly $318,904 of operating cash.
What are the steps to build a cash flow forecast?
Seven sequential steps build a cash flow forecast capable of withstanding lender or board scrutiny, and their order matters because each step supplies the next.
- Define the horizon and period length, either weekly across 13 weeks or monthly across 6–12 months.
- Establish opening cash from a completed bank reconciliation.
- Derive a collection curve from invoice history and apply it to scheduled billings.
- Schedule payroll, employment tax deposits, and vendor payments on their actual payment dates.
- Incorporate calendar obligations, including estimated tax installments, insurance renewals, and discretionary bonuses.
- Calculate each closing balance, then compare it with a defined minimum cash requirement.
- Record actual results every period, measure the variance, and recalibrate the assumptions.
The weekly variant appears in the guide to building a 13-week cash flow line by line. The sections below develop the monthly variant with complete arithmetic.
How do you set the opening balance?
Begin with reconciled book cash rather than the balance a banking portal displays. The portal excludes issued checks that have not cleared, along with deposits recorded in the ledger but not yet credited by the bank.
On September 30, the modelled company’s portal reports $1,184,300. Outstanding checks total $61,900, and deposits in transit total $17,400. Opening cash therefore equals $1,184,300 minus $61,900 plus $17,400, or $1,139,800.
That figure should agree with general ledger cash once the September bank reconciliation reaches completion. A forecast anchored to an unreconciled balance propagates the discrepancy into every subsequent month.
How do you forecast cash receipts from accounts receivable?
Apply a collection curve to each month’s billings. The curve quantifies what proportion of a month’s invoices historically arrives during the billing month and during each subsequent month.
Derive the curve from 6–12 months of paid-invoice history in QuickBooks Online or NetSuite. The modelled company collects 4% of billings within the billing month, 61% one month later, 27% two months later, and 6% three months later, while the remaining 2% proves uncollectible.
October receipts therefore combine four billing months:
- October billings contribute 4% × $1,690,000 = $67,600.
- September billings contribute 61% × $1,580,000 = $963,800.
- August billings contribute 27% × $1,610,000 = $434,700.
- July billings contribute 6% × $1,520,000 = $91,200.
October receipts total $1,557,300. A customer paying later than its historical pattern appears as a migration between columns, the dynamic our analysis of accounts receivable collections examines in detail.
When do payroll and tax deposits leave the account?
Net pay leaves on payday, whereas federal employment tax deposits follow IRS deposit rules that can defer them into the next period. A monthly forecast must therefore position each deposit on its required due date.
The modelled company pays $520,000 of gross wages on each semi-monthly payday. Net pay represents an assumed 70% of gross compensation, or $364,000. Withheld taxes plus the employer’s share generate an assumed $187,200 federal deposit for every payroll.
That deposit size activates the most accelerated schedule. According to IRS Publication 15, the rule applies to any employer accumulating “$100,000 or more in taxes on any day” within a deposit period. Such an employer must “deposit the tax by the next business day, whether you’re a monthly or semiweekly schedule depositor.”
Month-end paydays consequently straddle two columns. The deposit for the Friday, October 30 payroll falls due Monday, November 2. The Thursday, December 31 payroll includes a $140,000 year-end bonus, and its deposit shifts into January because January 1 is a legal holiday. December absorbs the bonus’s $98,000 of net pay, while January absorbs its $50,400 deposit.
Smaller employers follow a lookback test instead. Publication 15 designates monthly depositors as employers reporting $50,000 or less of taxes during the lookback period, with deposits due by the 15th day of the following month.
Which calendar items belong in the forecast?
Every obligation belongs in the month its payment leaves, including quarterly and annual commitments that never surface in a typical month. Three categories shape the modelled quarter beyond payroll.
- Vendor payments: invoices on net-30 terms settle one month after receipt, so September’s vendor obligations clear during October.
- Insurance renewal: an annual general liability and professional liability premium of $96,400 becomes payable in November.
- Estimated tax: IRS Publication 542 states that corporate installment payments “are due by the 15th day of the 4th, 6th, 9th, and 12th months” of the tax year.
Publication 542 also describes a method in which each required installment equals “25% of the income tax the corporation will show on its return for the current year.” As a calendar-year C corporation anticipating $438,000 of 2026 income tax, the modelled company remits $109,500 on December 15. Occupancy, software, and term-loan payments contribute a fixed $107,900 every month.
What does a working cash flow forecast template look like?
A working template arranges opening cash, receipts, disbursements by category, net cash flow, and closing cash vertically, with one column per period. The completed quarter for the modelled company appears below, stated in thousands of dollars.
| Line ($ thousands) | October | November | December |
|---|---|---|---|
| Opening cash | 1,139.8 | 1,274.8 | 1,365.3 |
| Customer collections | 1,557.3 | 1,623.7 | 1,671.3 |
| Net payroll | (728.0) | (728.0) | (826.0) |
| Payroll tax deposits | (374.4) | (374.4) | (374.4) |
| Vendor payments | (212.0) | (226.5) | (231.8) |
| Occupancy, software, debt service | (107.9) | (107.9) | (107.9) |
| Insurance renewal | 0.0 | (96.4) | 0.0 |
| Estimated tax installment | 0.0 | 0.0 | (109.5) |
| Net cash flow | 135.0 | 90.5 | 21.7 |
| Closing cash | 1,274.8 | 1,365.3 | 1,387.0 |
How do you roll the template from month to month?
Link each opening balance directly to the preceding closing balance, so a single formula chain governs the entire horizon. October closes at $1,139,800 plus $1,557,300 minus $1,422,300, or $1,274,800.
December’s net cash flow contracts to $21,700 because the bonus, the tax installment, and higher vendor payments coincide. Collections increase during the same month, so a revenue report would conceal the compression entirely.
How much cash should the forecast hold in reserve?
Establish a minimum cash requirement tied to the following period’s unavoidable disbursements, then classify any closing balance beneath it as a shortfall. For a professional services company, payroll provides the logical anchor.
The modelled company defines minimum cash as January’s payroll requirement: $728,000 of net pay plus $424,800 of deposits, including both deferred December 31 deposits. The resulting floor equals $1,152,800, leaving $234,200 of headroom against December’s projected closing balance.
How do you stress-test a cash flow forecast?
Rerun the model with one assumption moved against the business, beginning with the assumption that has previously failed. For a company invoicing on credit terms, collection timing represents the logical first test.
Suppose customer payments decelerate so that only 49% of October and November billings arrive one month later, rather than 61%. The delayed 12 percentage points arrive one month afterward.
- November receipts decline by 12% × $1,690,000, or $202,800.
- December loses $208,800 of November billings but recovers the delayed $202,800, a further $6,000 reduction.
- December therefore closes at $1,178,200, only $25,400 above the $1,152,800 floor.
A 12-point deceleration eliminates 89% of the available headroom without any change in revenue. Identifying that exposure in September preserves time to arrange a credit facility or renegotiate vendor terms.
How do you measure cash flow forecast accuracy?
Compare every forecast line with actual results once the period closes, expressing each variance as absolute percentage error: the absolute difference between actual and forecast, divided by the actual amount.
October closes with $1,492,600 collected against the $1,557,300 forecast, a $64,700 variance and a 4.3% error. An isolated variance proves little. Three consecutive variances in the same direction indicate an optimistic curve, which the finance team should recalculate from recent invoice history.
The discipline mirrors month-end variance analysis, applied specifically to liquidity. Under the Continuous Close Method™, Debit & Co. reconciles cash continuously throughout the month, so each forecast rolls forward from verified actuals. Kevin Cahill recalculates every client’s collection curve quarterly, because customer composition changes the curve over time.
Frequently asked questions
How do you forecast cash flows from your financial statements?
Apply the indirect method. Begin with projected net income, add back non-cash expenses such as depreciation, subtract increases in receivables, and add increases in payables. Then deduct planned capital expenditures and incorporate borrowing or equity activity to determine the projected change in cash.
How do you calculate a cash flow forecast for a startup?
An early-stage company typically forecasts net burn directly: payroll, vendors, and software subscriptions minus the limited receipts that materialize. Dividing available cash by monthly net burn produces runway, so $2.4M of cash at $190K of monthly net burn lasts approximately 12.6 months.
Can you build a cash flow forecast in Excel?
Excel works well for the purpose. Arrange periods in columns and cash categories in rows, and link each opening balance to the preceding closing balance. Isolate assumptions such as the collection curve on a separate input tab. Aging and payables reports from QuickBooks Online or NetSuite supply the underlying detail each period.
What is the difference between a cash flow forecast and a cash flow projection?
Many finance teams use the terms interchangeably. Where practitioners distinguish them, a forecast represents the expected case updated with actual results. A projection models a hypothetical scenario, such as an expansion hiring plan or a financing round. Both share the identical opening, receipts, disbursements, and closing structure.
Why do cash flow forecasts go wrong?
Three failures recur: collections assumed earlier than customers historically pay, irregular obligations such as insurance renewals and estimated taxes omitted, and an opening balance copied from an unreconciled banking portal. Each error distorts every subsequent closing balance, which is why the variance log matters more than the initial draft.